Analysis of consumption and prices in the first five months of 2020
The influence of Covid-19 and the temperate winter: comparison with last year
We compare the consumption trend of the first five months of this year with the same period last year and examine the consequences in terms of price formation.
We can describe with relative certainty the reasons for the decline in consumption and spot and forward prices and attribute the main responsibilities that affected consumption and prices to the temperate winter and the Covid-19 emergency.
The month of January 2020 was only affected by above-average temperatures and an overabundance of gas across Europe. The dispute over tariffs between the US and China seemed to be over, there was certainty of Great Britain’s exit from the EU and oil producers were united in the name of controlling world production. In terms of prices, tensions in Libya and Iraq-Iran had brought Brent to 70 dollars a barrel at the beginning of the year.
Already at the end of January, however, the explosion of an outbreak of Covid-19 infection in the Chinese city of Wuhan had led to the adoption of exceptional measures and the blocking of many production activities also in the rest of China, with strong limitations on the movement of people and goods to and from the Asian country. Since February, Brent had begun to decline until it reached $20 a barrel in mid-April.
Italy had been feeling the effects of Covid-19 since February and, subsequently, the rest of the world began to feel the effects. Confinement measures began in Italy on 9 March, with the adoption of the emergency protocol which imposed restrictions on the free movement of people for health reasons. On March 11, Covid-19 was declared a pandemic and by the end of the month 187 countries had adopted lockdown measures.
The winter months, not just January, were characterized by above-average temperatures and a surplus of LNG, elements that contributed to decreasing spot and forward prices of natural gas across Europe.
The consequences immediately affected consumption, spot and forward prices which had reached historic lows.
An analysis is shown in the form of graphs and tables, relating to the consumption and prices of electricity and natural gas.
1. Electric energy
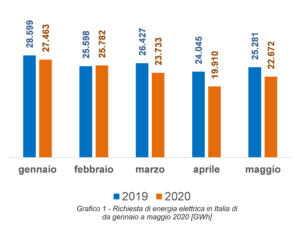
• (Graph 1) Trend in Italian gross domestic electricity consumption in the first five months of the year.
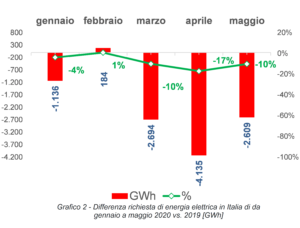
• (Graph 2) Difference in electricity demand in Italy from January to May 2020 compared to the same period in 2019.
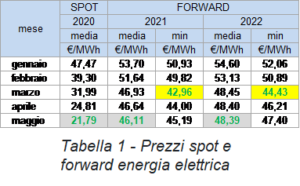
• (Table 1) Table with average spot prices (Electricity Exchange) and forwards for the years 2021 and 2022 (EEX Settlement)
2. Natural gas
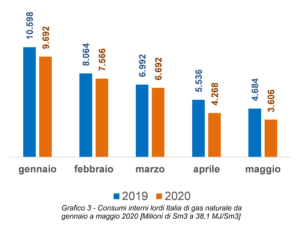
• (Graph 3) Trend in Italian gross domestic consumption of natural gas in the first five months of the year, determined by adding national production, imports and deducting exports and changes in stocks.
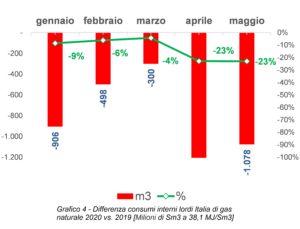
• (Graph 4) Difference in Italy’s gross domestic consumption of natural gas in 2020 compared to the same period in 2019.
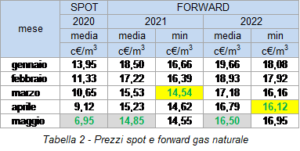
• (Table 2) Table with average spot prices (GME MGP-GAS) and forwards for the years 2021 and 2022 (Settlement PSV).
The months of March, April and May 2020 recorded a decrease of 10%, 17% and 10% respectively compared to the same months of 2019 as can be seen from the graph relating to the differences.
Monthly spot and forward electricity prices reached their lowest prices in May. Spot prices reached the value of €0.00/MWh in some hours of April, also thanks to the massive contribution of photovoltaic energy. Forward prices reached their lowest values in March. Note the clear situation of contango, i.e. a situation with spot prices lower than forward prices.
The months of January, April and May 2020 recorded a decrease of 9%, 23% and 23% respectively compared to the same months of 2019 as can be seen from the graph relating to the differences.
The months of January, April and May 2020 recorded a decrease of 9%, 23% and 23% respectively compared to the same months of 2019 as can be seen from the graph relating to the differences.
Monthly spot and forward natural gas prices hit record lows in May. Spot prices reached the daily minimum value of 5.30 €c/m3 in May. Forward prices reached their lowest values in March and April. Also noteworthy in this case is the clear situation of contango, i.e. a situation with spot prices lower than forward prices.
A similar trend in consumption was also recorded at a European level, with significant decreases during the Lockdown periods, which were followed by a downward trend in prices.
In this regard, it is interesting to examine a comparison of the peaks of electrical power withdrawn from the grid and the spot prices on the electricity exchanges in Italy, Germany, France and Spain from 21 March to 10 April shown a week ago in a webinar organized by the Aiee, the Association Italian energy economists.
The start dates of the Lockdown measures are similar but different between States, as can be seen below: Italy 9 March, Spain 14 March, France 17 March and Germany 21 March.
The following graphs are shown (Graphs 5 and 6) referring to the comparison between the 2020 data and those of 2019 in the same period (from 21 March to 10 April):
1. Change in peak capacity during the 2020 Lockdown period vs. 2019
2. Change in spot prices on electricity exchanges during the 2020 Lockdown period vs. 2019
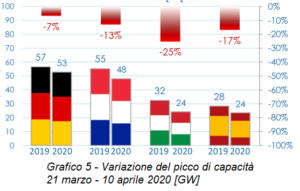
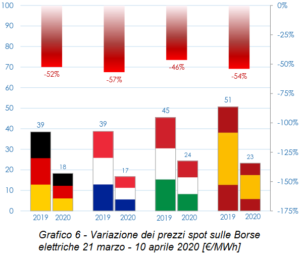
The downward trend in power peaks and spot prices detected in Italy is confirmed in the other countries taken into consideration. A similar trend occurs with forward prices and similarly for natural gas.
This analysis leaves some ideas, which we would like to summarize in points:
• The market is influenced by many factors, some of which are completely unpredictable (for the beginning of 2020 Covid-19, for the end of 2016 the news of the blockade of 17 French nuclear power plants).
• Locking the price once a year allows you to have certainties but, in the event of a market collapse, forces you to maintain high prices.
• Choices to block part or all of the supply at a fixed price can be aided by the analysis of historical prices and PTE is available to help its companies in managing a structured purchase.
• In some cases it may be interesting to evaluate having a percentage of supply at a variable market price, trying to introduce a certain degree of uncertainty on prices, obviously after having judged this variable acceptable.
PTE is available to assist their companies in purchasing electricity and natural gas and to evaluate the best type of purchase.
Articoli recenti
- Initiatives of electricity and gas suppliers in the time of COVID-19 21/12/2023
- Port of Trieste: analysis of the level of environmental energy sustainability 21/12/2023
- Appointment of the Energy Manager for large consumers 21/12/2023
- Obligation to appoint an energy manager for large consumers 21/12/2023
- Bill decree 2023 21/12/2023